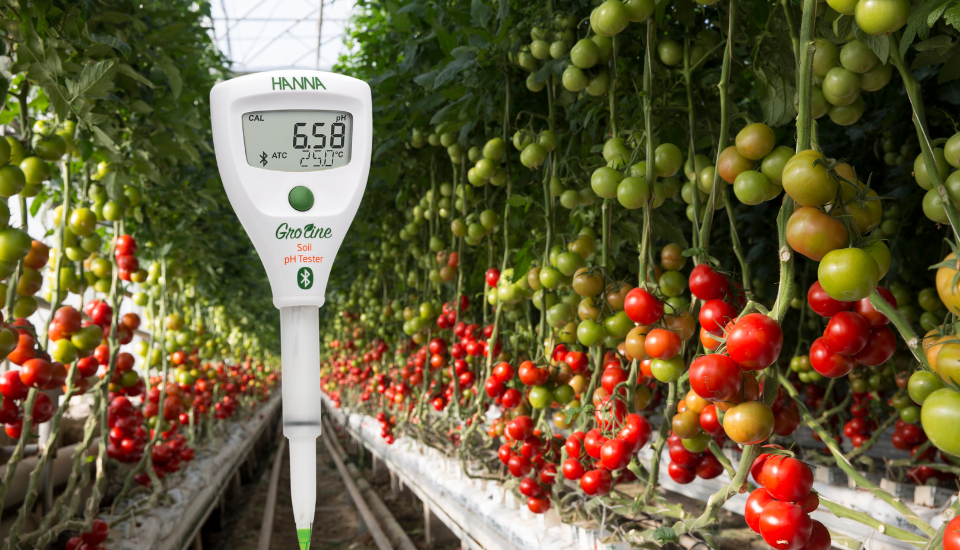
The Importance of pH Levels in Agriculture and Gardening When it comes to growing crops, pH levels are vital. The pH level of soil, water, and nutrient solution can have a significant impact on your plant growth, nutrient availability, and overall crop yield. In this article, we will explore why pH levels are so crucial when growing food, how to test and adjust pH levels, and the benefits of maintaining optimal pH levels for plant growth. What is pH? pH is a measure of the acidity or alkalinity of a solution, with a range from 0 to 14. A pH of 7 is considered neutral, while values below 7 are acidic, and values above 7 are alkaline or basic. pH levels are important because they affect the chemical and biological processes that occur in soil and plant roots. Why are pH levels important when growing food? 1. Nutrient availability The pH level of the soil, water, or nutrient solution can affect the availability of nutrients to the plants. Each plant has a preferred pH range for optimal growth and nutrient uptake. For example, most vegetables and fruits grow best in soil with a pH range of 6.0 to 7.0. If the pH is too high or too low, some nutrients, such as nitrogen, phosphorus, and potassium, may become unavailable to the plants. This can lead to stunted growth and nutrient deficiencies. 2. Microbial activity The pH level of the soil also affects the activity of microorganisms in the soil, such as bacteria, fungi, and bugs. These microorganisms play a crucial role in breaking down organic matter and releasing nutrients for plant uptake. However, their activity is influenced by the pH level of the soil. For example, some bacteria and fungi prefer acidic soil, while others prefer alkaline soil. If the pH is not in the range suitable for their growth, microbial activity may be hindered, and the soil’s fertility can be affected. 3. Pesticide efficacy The pH level of the water used to mix pesticides can affect their efficacy. Pesticides work best in water with a neutral pH of 7. If the water is too acidic or alkaline, the effectiveness of the pesticide may be reduced. This can lead to increased pesticide use, which can be harmful to the environment and human health. How to test pH levels? There are several ways to test soil pH levels, depending on the type of solution you want to test. For soil, you can use pH testers or pH test kits. For water or nutrient solutions, you can use pH test strips, a pH pen, or a waterproof pH tester. The testing process is straightforward and can be done at home with pH testers supplied by HANNA INSTRUMENTS. How to adjust pH levels? If the pH level is too high or too low, you can adjust it by adding amendments to the soil or nutrient solution. For example, if the pH of the soil is too acidic, you can add lime to raise the pH. If the pH is too alkaline, you can add sulfur or organic matter to lower the pH. Similarly, if the pH of the nutrient solution is too high or low, you can add pH-adjusting chemicals to bring it to the desired level. Benefits of maintaining optimal pH levels for plant growth 1. Improved nutrient availability One of the primary benefits of maintaining optimal pH levels for plant growth is that it improves the availability of essential nutrients. Each plant species has a specific pH range in which it grows optimally, and when the pH level is outside of this range, nutrients can become unavailable to the plant. 2. Disease resistance Maintaining optimal pH levels can help plants build resistance to diseases and pests. Soil pH influences the microbial community in the soil, and some microorganisms are beneficial for plants. For example, some bacteria help fix nitrogen. Proper pH levels help maintain a balanced microbial community, reducing the risk of diseases and pests. 3. Water uptake pH levels influence water availability in the soil. At low pH levels, the soil becomes more acidic, reducing the soil’s ability to retain water. At high pH levels, the soil becomes alkaline, which can cause waterlogging and reduce oxygen availability to the roots. 4. Enhanced growth and yield Perfect pH levels enable plants to take up essential nutrients and water, leading to healthy growth and higher yield. Plants that are not grown in an optimal pH environment can experience lower yields, and poor-quality produce. In conclusion, maintaining optimal pH levels is critical for plant growth and development. It enables plants to access essential nutrients, build resistance to diseases and pests, ensure water availability, and promote healthy growth and higher yields. Need products to help facilitate healthy growth? From farms, greenhouses, and homes we provide innovative instrumentation for growers at all levels. Related posts Growing in Spring: Data vs. Tradition with a Focus on Soil Testing Growing in Spring: Data vs. Tradition with a Focus on Soil Testing As technology advances, the world of agriculture is… Read more Transforming effluent into sustainability: Protecting communities and preserving the environment Transforming effluent into sustainability: Protecting communities and preserving the environment Wastewater treatment plays a pivotal role in preserving the environment… Read more GroLine: pH, EC and TDS Meters Designed for Agriculture and Hydroponics GroLine: pH, EC and TDS Meters Designed for Agriculture and Hydroponics Hanna Instruments GroLine products are designed with the hydroponics grower in… Read more Subscribe to our newsletter
8 Essential Tools For Home Brewing Beer Home brewing has become an increasingly popular pastime within Australia, with people of all backgrounds and levels of experience taking up the hobby. The process of home brewing can be confusing, but it is also incredibly rewarding. To get the most out of your home brewing experience, it’s important to have the right home-brewing instruments. Here are eight essentials for the brewers out there: 1. Haze Meter A haze meter is a tool that measures the level of haze in your beer. Haze is caused by a variety of factors, including suspended particles, yeast, and proteins. A high level of haze can affect the appearance and taste of your beer. By using a haze meter, you can ensure that your beer is clear and bright and that there are no unwanted particles or sediment. Check out the haze meter for more information. 2. Fermenter A fermenter is where the magic happens in beer brewing. It’s the vessel where yeast converts the sugars in your wort into alcohol, creating the signature flavor and aroma of beer. There are many different types of fermenters available, from glass carboys to plastic buckets. Choosing the right fermenter for your setup is important, as it can impact the final product. 3. pH Meter The pH level of your beer is an extremely important factor in the brewing process. The pH level affects the taste, clarity, and stability of your home-brewed beer. A pH meter is a tool that measures the acidity or alkalinity of your beer, allowing you to adjust the pH level to achieve the desired flavor and clarity. Hanna has a great selection of pH meters you can view for all home brewing needs, including the Halo Range suitable for hobbyists. 4. Hydrometer A hydrometer is a tool that measures the specific gravity of your beer. Specific gravity is a measure of the density of the liquid, which changes during the brewing process. By measuring the specific gravity before and after fermentation, you can calculate the alcohol content of your results. See our beer line hydrometer for specifications. 5. Thermometer Temperature control is critical to the brewing process, as it affects the flavor, aroma, and clarity of your beer. A thermometer is essential for monitoring the temperature during the brewing and fermentation process. It allows you to ensure that your beer is at the ideal temperature for the yeast to do its job and ensure the perfect taste. 6. Auto-Siphon An auto-siphon is a device that makes the transfer of beer from one container to another easy and efficient. It eliminates the need for manual siphoning, which can introduce unwanted air and bacteria into the beer. An auto-siphon is a must-have tool for anyone who wants to transfer their brew between containers without risking contamination. 7. Bottling Bucket A bottling bucket is a container used to transfer beer from the fermenter to bottles. It is an essential tool for any home brewer who wants to bottle their beer. The bottling bucket has a spigot at the bottom, which allows for easy and efficient filling. 8. Refractometer A refractometer is a tool that measures the sugar content of your wort. By measuring the sugar content, you can calculate the alcohol content of your home-brewed beer. Refractometers tend to be more accurate than hydrometers, especially when measuring sugar contents specifically. Hanna supplies refractometers here. In conclusion, home brewing is a rewarding hobby that requires the right tools to produce high-quality beer. The eight tools listed above are essential for anyone who wants to brew great beer at home. By using Hannas tools, you can ensure that your beer is clear, flavorful, and has the perfect alcohol content. Happy brewing! Related posts The power of refractometers in the food industry Enhancing accuracy and efficiency: The power of refractometers in the food industry Refractometers are commonly used in the food industry… Read more Refractometer: Everything you need to know Refractometer: Everything you need to know. What is a refractometer? A Refractometer is a scientific instruments that measures the refractive index of… Read more pH & TA in Sour Beers pH & TA in Sour Beers Over the last few years, there has been an influx of unusual brews that… Read more Subscribe to our newsletter
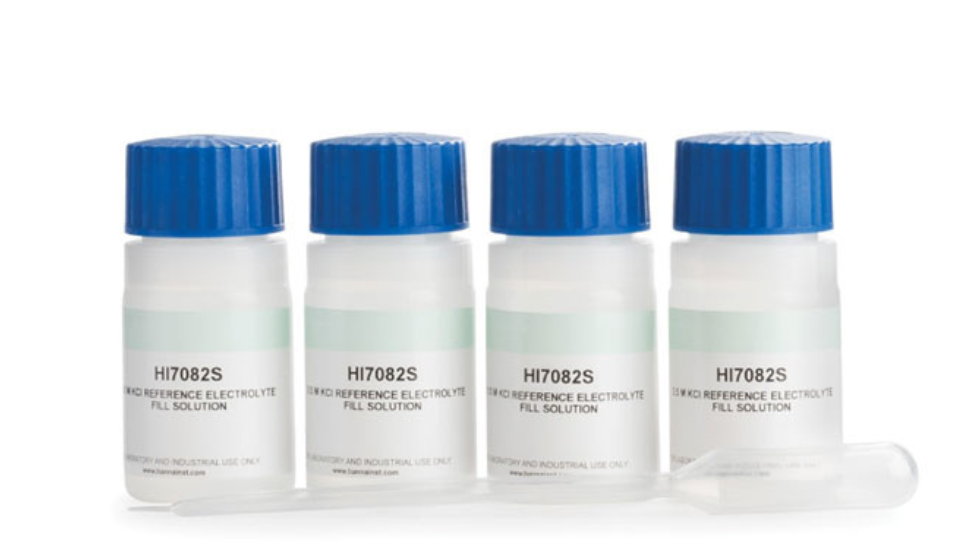
Analytical Wine Testing for Winemakers Organising and planning the winemaking process is as important as the planting and picking of the fruits. Today’s winemaking process should integrate analytical testing and equipment to test pH, SO2, TA and Brix.Hanna Instruments have put together a guide of tools and equipment used in winemaking to help you get ready for the season and get accurate and consistent testing results. How to get ready for wine testing The following are the essential things you need to do for the successful testing of your wine. Check your Buffers, Solutions, and Reagents Using fresh products is crucial for successful winemaking. Make sure that buffers, solutions, and reagents are within their stated shelf life. If they have been open for more than six months, they should be replaced. Calibration buffers: Always use fresh buffer solution for calibration as this ensures that the buffer being used is not contaminated. Please keep track of how long the solution has been opened and check its expiration date. Sometimes, these solutions may expire before the specified expiration date due to evaporation and influx of atmospheric carbon dioxide. Hanna Tip: When measuring pH in wine, it is best to calibrate to two points. Most meters will allow for pH 7.01 and pH 4.01 calibration. Ideally, calibration should be done to pH 7.01 and pH 3.00. This allows the calibration to bracket the expected value, which for wine is less than pH 4. Some meters are pre-programmed or allow for a custom calibration point (i.e. pH 3.00). Electrode Cleaning Solution: Electrodes may become dirty from regular usage and may produce inaccurate readings. A clean electrode is critical for an accurate and stable pH reading. The use of an electrode cleaning solution will eliminate any impurities and residues. Residues can accumulate on the surface of electrodes when immersed in samples during measurement or when stored incorrectly. Additionally, clogging of the junction will result in increased resistance, sluggish and erratic readings, and affect the junction potential. To ensure that the probe is clean and to prevent any clogging of the junction, consider cleaning the bulb and junction of your electrode periodically with an electrode cleaning solution. Hanna Tip: To remove stains and deposits accumulated on the electrode’s surface, use the Hanna electrode cleaning solution for wine deposits and stains. These solutions are preferred over a general-purpose cleaning solution as they are formulated for a specific purpose. Electrode Storage Solution: The electrode storage solution is specifically formulated for keeping the pH bulb hydrated and maintaining a free-flowing junction. Electrodes must always be kept in storage solution when not in use. The diffusion of the internal electrolyte through the junction will be impeded if the junction is allowed to dry out. The potential of the junction, stability and response time of the electrode will be adversely affected if it is left to dry out. Therefore, electrodes should be stored correctly; otherwise, the life and performance of the electrode will rapidly deteriorate. Hanna Tip: Do not leave the electrode in deionised, purified, or distilled water. This increases the diffusion of the reference electrolyte into the solution and causes water to move into the reference cell by osmosis. Moreover, it can adversely affect the function of your electrode. Storage solutions are formulated to minimise any concentration gradient between the internal reference and the sample and prevent any organic growth Electrode Fill Solution: As the electrolyte level inside refillable pH or ORP electrode gradually drop over time, it must be topped up with the appropriate electrolyte refill solution to maintain an adequate level. This will ensure a positive head pressure, thus allowing for the electrolyte to flow through the junction into the sample. This is crucial as the ions in the electrolyte electrically connect the meter and electrode with the wine sample being tested. Check the levels of electrodes regularly. Hanna Tip: Single junction pH and ORP electrodes use potassium chloride (KCl) solution saturated with silver chloride (AgCl), while double junction electrodes use only KCl. The diagram below will help you to identify what type of electrode you have. Hanna Buffers and Solutions HI7007L pH 7.01 buffer (500 ml) HI7004L pH 4.01 buffer (500 ml) HI5003 pH 3.00 buffer (500 ml) HI70300L Electrode storage solution (500 mL) HI70635L Cleaning solution for wine deposits (500 mL) HI70636L Cleaning solution for wine stains (500 mL) HI7082 Electrode filling solution for double junction electrodes (4 X 30 mL) HI7071 Electrode filling solution for single-junction electrodes (4 X 30 mL) Test and prepare your Electrodes Electrodes should be checked for functionality before using them. The overall condition of your electrode depends on offset (pH7.01 mV value) and slope (difference between pH 7.01 mV and 4.01 mV). It is crucial to maintain them, and any deviation from the recommended values will result in erroneous readings. The following is the procedure to determine the condition of your electrode and prepare them for your next use. Use fresh buffers to check the offset and slope of your pH electrode. If the meter you are using has the Good Laboratory Practice (GLP) feature, it will provide the last calibration data. If your meter does not have the GLP feature, you can use any meter with an mV mode to check your pH electrode. Prepare your electrode by removing its protective/storage cap. If the pH bulb is dehydrated, leave it in a storage solution overnight and remove the fill hole screw cap. Now, it’s time to prepare the calibration buffers. Fill 2 beakers with enough pH buffer solution 7.01 to cover the pH electrode junction. Use the solution in one of the beakers to rinse your pH electrode and the second one for calibration. Repeat this procedure for a pH 3.00 buffer. Once you have prepared your electrodes and calibration buffers, begin performing calibration. Start with rinsing your pH electrode in the pH 7.01 rinse beaker and stir gently for 4 to 6 seconds. Place the electrode in the pH 7.01 calibration beaker and stir gently for 4 to 6 seconds. Then, wait for the reading to stabilise (digits on

What is Refractive Index ? What is Refractive Index ? Refractive index, also known as index of refraction, refers to the optical characteristic of a certain substance and the dissolved particles in it.In other words, the refractive index measures the ratio of the speed of light in a vacuum to the speed of light in the substance of interest. As light travels through substances of different refractive characteristics or densities, it will bend or change direction.Refractive index can be measured with the formula:n = c / vn being the index of refraction,c being the speed of light in a vacuum or airv being the speed of light in the media, such as water, olive oil, etc. What is the principle of Refractive Index? As light enters a material with a higher refractive index, the refraction angle will be smaller than the angle of incidence, resulting in the light being refracted towards the normal of the surface. The higher the refractive index, the closer the light will travel to the normal direction.When passing from a material with a higher refractive index to a lower refractive index, there is a critical angle where the two substances meet, at which light can no longer refract but will instead reflect. This critical angle is used to calculate the refractive index for the materials used in personal hygiene production. Factors Affecting Refractive Index Refractive index values are strongly influenced by temperature as well as the wavelength of light used to measure it.Therefore, care must be taken to control or compensate for temperature differences and wavelength. To achieve the most accurate result, it is best to measure the refractive index at standard temperature.Refractive index measurements are typically reported at a reference temperature of 20°C (nD20) or reported uncompensated (nD). Substance Refractive Index Vacuum 1.0000 Air 1.0002 Liquids at 20 °C, wave-length of 589.3 nm 1-propanol 1.3848 2,4-Dichlorotoluene 1.5463 Acetone 1.3588 Aloe extract 1.334 Beer 1.346 Bromonaphtalene 1.6578 Butter 1.450 Coconut oil 1.440 Coffee 1.345 Cow milk 1.359 Dodecane 1.4218 Ethanol 1.3338 Glycerol 1.477 Honey 1.520 Ketchup 1.385 Natural rubber 1.540 Peanut oil 1.469 Plain yoghurt 1.345 Propylene glycol 1.432 Sodium Chloride 1.334 Sodium hydroxide 1.333 Soy milk 1.350 Sulfuric acid 1.335 Sunflower oil 1.474 Virgin olive oil 1.469 Water (deionised) 1.333 Solids at room temperature Diamond 2.417 What is refractive index used for? Any material that interacts with light has a refractive index. The refractive index measurement is used in many industries to check the purity and concentration of liquid, semi-liquid, and solid samples, such as food, pharmaceuticals, and manufacturing industries.Liquids and semi-liquid samples can be measured with high accuracy (down to ± 0.00002). Plus, the index of refraction can be correlated to a wide range of concentrations that can be used to characterise a wide range of samples in various industries and applications.For example: Food and beverage: To measure the Brix (sugar content) in soft drinks, or the Oechsle of grapes in winemaking. Chemical: To determine the freezing point, the presence of organic solvent and inorganic salt, or acid/base concentration. Pharma: To measure hydrogen peroxide or methanol percentages, or assess concentrations of different substances in human urine. In some applications, the combination of refractive index with density measurement also creates a simple yet highly accurate quality control process. How do impurities affect refractive index? Impurities can affect refractive index in two ways: Liquid impurities with a higher refractive index than the liquid sample will cause the velocity of light in the medium to decrease, therefore increasing the refractive index value. Liquid impurities with a lower refractive index than the liquid sample will cause the velocity of light in the medium to increase, therefore decreasing the refractive index value. Measuring Refractive Index in Personal Hygiene Production It is important to measure the refractive index in raw material ingredients when manufacturing personal hygiene products to ensure that the desired qualities are achieved in the final product.For example, when producing makeup that reflects light, such as foundations that give the user a glowing complexion, raw materials that refract and reflect light such as mica should be used. On the other hand, for products that are meant to cover lines or imperfections in the skin, manufacturers need to go for materials that absorb light and have low refraction, such as iron oxides.Measuring the refractive index in lotions and hair products will also help ensure quality control. When it comes to shampoos and conditioners, silicone compounds are added to the products to enhance shine on the user’s hair. Due to the high refractive index of phenyl dimethicone, this silicone compound is often used in leave-in conditioners to generate a high degree of shine on the hair.A recent market trend in personal hygiene products is clear gel, and this is seen recently in deodorants, hand sanitisers, shampoos, liquid soap, and more. To create clear gel, it is important to match the refractive indexes of the aqueous and non-aqueous components in the emulsion. Digital Refractometer for Personal Hygiene Manufacturer A manufacturer of lotions, creams, shampoos and body washes was looking to measure the refractive index of their final products and raw material ingredients for quality control and reporting purposes.A typical personal hygiene product such as body wash contains water, surfactants or detergent, anti-bacterial compounds, fragrances, essences, and (sometimes) pH adjusters. Although the refractive index measurement of a raw material or a finished product is not an indicator of individual component concentrations, it is important to ensure product consistency from batch to batch. The refractive index of a final product can confirm that all the required components are present in the correct concentration, ensuring that the product will meet quality standards. Digital Refractometer For Refractive Index And Brix – HI96800 For this purpose, the manufacturer’s laboratory team decided to get the Digital Refractometer for Refractive Index and Brix – HI96800 for the measurement of refractive index and % Brix in aqueous materials. They were pleased with its affordable price, and that the refractometer reported the refractive index directly. The HI96800 refractometer also features automatic temperature compensation
Identify Rancid Food by Testing for Peroxide Value Is Your Food Safe To Eat? Every food you purchase comes with a use-by and best-before date, and that is usually a good mark to judge on whether the food is still safe for consumption. However, in some cases, food can go bad without you knowing. Rancidity in foods and oils can creep up on you and you might barely notice it. Protect your products from rancidity by testing for Peroxide Value. What is Rancidity? Rancidity refers to the complete or partial oxidation or hydrolysis of fats and oils when they are exposed to heat, air, moisture, light, or bacterial activity. It affects taste and odour, causing the rancid food to have a certain off flavour and smell, and will have an impact on the quality of your end product. Many foods can become rancid during storage, including vegetable oils, olive oils, alternative oils, butter, nuts, grains, flour, baked goods, animal food, animal feeds, and more. For example: have you ever opened up a bag of dog kibble and noticed a stale or sour odour? Odds are the fats and protein in the food have gone rancid, especially if the food wasn’t stored properly or had been exposed to heat or humidity. Essentially, anything that contains fat or oil can be subjected to rancidity, and this includes a wide variety of processed products such as cookies, chips, and trail mix bars. Fats that are highly processed face a higher risk of becoming rancid. For example, the fats in potato chips and cookies are all exposed to high heat, and this expedites the oxidation process on the road to rancidity. However, even fresh foods can go rancid. Frying oils that are heated and reused over and over again will become rancid quickly, creating some sort of a fishy smell that would affect the taste of your food. How to Identify Rancid Food? The first thing you’d notice – SMELL One of the first and most noticeable signs of rancid foods is the smell. Rancid foods tend to have a certain unpleasant or stale odour. The odour can vary, but has often been described as wet cardboard, wood varnish, oil paint, or play dough. So if something smells funky, weird, or just not like how it does usually, it may be time to throw it out. Does it still TASTE good? One of the first and most noticeable signs of rancid foods is the smell. Rancid foods tend to have a certain unpleasant or stale odour. The odour can vary, but has often been described as wet cardboard, wood varnish, oil paint, or play dough. So if something smells funky, weird, or just not like how it does usually, it may be time to throw it out. How does the food FEEL? In advanced stages of rancidity, certain physical characteristics of the food or product can change as well. If your bottle of oil feels sticky, that could be a sign that your cooking oil is going through polymerisation, which is an advanced stage of the rancidity process. How does the food LOOK? How the food looks visually can be a good sign too as to whether it has become rancid. Does the oil look darker than usual? Is there mould on the jar? Does the salad look pale or soggy? Although we do not like to judge based on appearances, this is one of those times when you absolutely are allowed to do so. Throw the food out if it does not look good to you. Will rancid food harm you? The dangers of consuming rancid foods are inconclusive. According to the US Centers for Disease Control and Prevention, there are very few documented outbreaks of gastrointestinal illness associated with the consumption of rancid food. However, eating rancid food may contribute to digestive issues. Rancid foods are also less nutritious, as oxidation breaks down the fatty acids and destroys the good fats as well as some of the vitamin content. This in turn can lead to packaged and shelved food having inaccurate labeling, due to the rancidity that has set in by the time of consumption. Generally, most experts agree that rancid foods are toxic and should be avoided where possible. Some have also cautioned that the regular consumption of rancid foods may contribute to negative health effects, including inflammatory disease, cardiovascular disease, and even certain cancers. Should I test my ingredients and raw products for rancidity? Rancidity testing is an important part of the quality assurance and production process in the food industry. Testing allows you to know the level of oxidation in a sample, and makes it easier to monitor your product’s potential shelf life, stability, as well as flavour or smell consistency. If you are purchasing ingredients, it is highly recommended that you check oils, fats, nuts and grains, among others, to ensure that they are of the highest quality possible. Testing the rancidity in these foods will allow you to see how far into the oxidation process these foods may be. You can then plan your usage of these ingredients accordingly, to avoid having to dispose of rancid ingredients later on and losing money. It also helps you to adjust and fine-tune your stock purchasing schedule, as well as monitor the quality of your existing ingredients. As a supplier, it is essential to be able to deliver the best possible product. Testing for rancidity will allow you to back up the freshness and overall quality of your product, and ensure customer satisfaction. If a consumer purchases your product and notices that the smell or flavour is not up to their expectation, they may return the product and request for a refund. Their opinion of the product and your business may also be negatively affected, which would subsequently damage your brand reputation. Or worse, if your product is rancid and it causes the consumer to be sick, your business may be liable to lawsuits or penalties. How do I

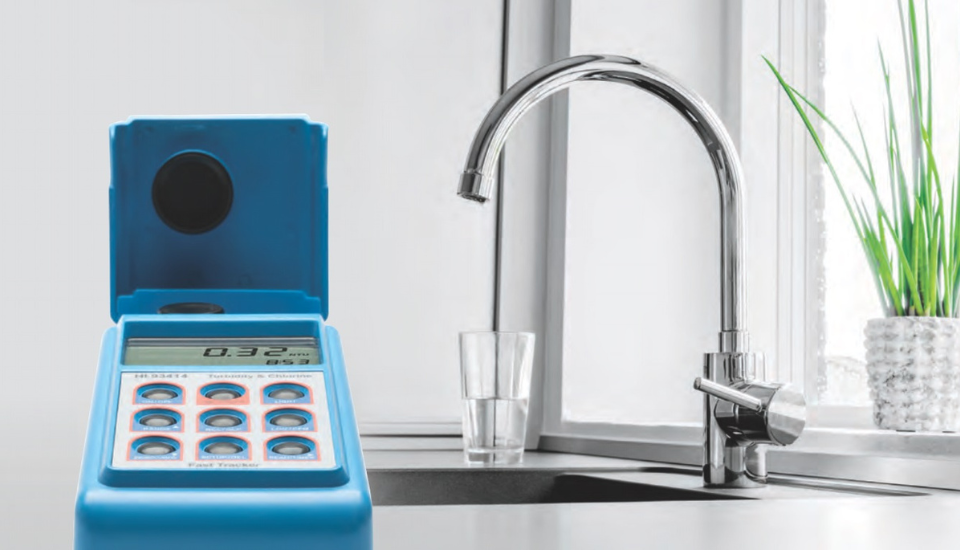
Monitoring Water Quality – Disinfection Part 1. Disinfection Properties of water bodies vary based on natural factors such as landscape position and slope, watershed size, geology, and soil composition, as well as man-made pollution. Before a water source can be used for human, animal, or plant consumption, it must be assessed and possibly treated to make sure it is safe for consumption. In a series of blog posts we will discuss some of the most important parameters in assessing water quality and Hanna’s solutions for measuring these parameters. One of the main goals of water treatment is to kill disease-causing organisms (pathogens). This is achieved using chemical compounds with disinfectant properties. Once pathogens have been removed during wastewater disinfection, any residual disinfectant must be removed prior to discharge into a natural water body. There are several disinfectant compounds available, including chlorine, ozone, bromine, and iodine dosing systems, of which chlorine is the most common. Chlorine Chlorine is one of the most cost-effective disinfectants used in a variety of different applications. Its use varies from light application in surface sanitation to heavy-duty disinfection of medical devices, to removal of microorganism infections in piping systems. The advantage of using chlorine over peroxide-type disinfectants is that chlorine is not only a strong oxidant, it also is capable of breaking tough chemical bonds found in cell walls or biofilms. Correct and effective use of chlorine helps to destroy disease-causing pathogens, reduce odors, and eliminate bacteria.Chlorine levels must be actively monitored to ensure sufficient chlorine is present for disinfection, as well as to control adverse effects such as taste, odor, and potential reactions with organic matter to form harmful disinfection by-products. It is important to note the difference between free and total chlorine. Free chlorine refers to available forms of chlorine, such as hypochlorous acid and hypochlorite, which are added to solutions for disinfection. When free chlorine combines with contaminants, it becomes combined chlorine, otherwise known as chloramines. Once chlorine is combined, it has a decreased ability to disinfect. The measure of total chlorine will always be higher than free chlorine, as it is the sum of both free chlorine and combined chlorine. Thus, measuring free chlorine is a direct indication of the effectiveness of the sanitizing solution. Hanna Instruments offers a wide range of instrumentation for measuring chlorine. From Chemical Test Kits and Checker Handheld Colorimeters to single and multiparameter field meters and benchtops, Hanna has an accurate, affordable solution for nearly any free and total chlorine application. Ozone Ozone is a very strong oxidizing agent that destroys organic compounds that are especially difficult to oxidize. It is used as a disinfectant to kill disease-causing organisms and to remove manganese, combined chlorine, and other organic material from water. Ozone’s efficacy as a disinfectant is not affected by pH Ozone is a naturally unstable compound and usually breaks down completely by the end of the water treatment process without the need for any additional chemicals to be added. In addition to this, the lack of harmful by-products, high efficiency, and exceptional removal of bad odors makes it ideal for wastewater treatment. However, as a general principle, once pathogens have been removed during wastewater disinfection, any residual disinfectant must be removed prior to discharge into a natural water body. Bromine In many countries, bromine sanitizing has been introduced as an alternative to chlorine. Although it is not as strong as chlorine, it is more stable at higher temperatures and pH levels. There is very little reaction between bromine and nitrogen compounds reducing the unpleasant odors. Bromine is most often used in the sanitization of drinking water systems, pools and spas, and cooling towers. Like chlorine, excess amounts of bromine in water can be dangerous to health and can cause eye irritation. Daily monitoring of bromine concentration prevents damage to equipment and contributes to the optimization and efficiency of the process while providing for increased user safety. Iodine The disinfectant properties of iodine have led to its use as an alternative to chlorine and bromine. Unlike chlorinated pools, water treated with iodine decreases eye irritation among swimmers and provides a level of disinfection more stable to adverse conditions. However, its toxic and corrosive properties, along with the difficulties of dissolving it in water, have limited its widespread acceptance. One of the most common applications of iodine is in the poultry industry process water. Hanna Instruments offers a range of portable and benchtop photometers in single or multiparameter formats that can measure these and other elements. To explore our range of photometers, click on the links below. Related posts How to Use a pH Meter for Water Testing How to Use a pH Meter for Water Testing Maintaining the right pH level in water is crucial for various… Read more The role of free chlorine in keeping drinking water safe The role of free chlorine in keeping drinking water safe Clean drinking water is essential to human urvival. To make… Read more The Importance of Measuring Turbidity in Water The Importance of Measuring Turbidity in Water Turbidity of water is an optical property that causes light to be scattered… Read more Subscribe to our newsletter
The Ultimate Guide to Sanitizers and Disinfectants Sanitizing… Is paramount in today’s day and age. While the world strives to cope with a global pandemic, how do you know that you are sanitizing properly? Or what is the best sanitizer to use? Can you use different sanitizers at the same time? Read on to find out more! What is Sanitation? Defined by the FDA, sanitation is “the application of cumulative heat or chemical on a clean food contact surface that, when evaluated for efficacy, is sufficient to yield a reduction of 5 logs which is equal to 99.9999 percent reduction of representative disease microorganisms of public health significance. Sanitation does not only apply to food production, but also to food service, water treatment, breweries, pools & spas, health clubs, paper & pulp, hospitals, and healthcare services among others. In this article, we will be focusing on the application of chemicals for effective disinfection. Cleaning vs. Sanitizing? One of the key steps to ensuring the effectiveness of sanitation is to start with a clean surface. It is important to recognize the distinction between cleaning and sanitizing. Cleaning focuses on removing oil, grease, and debris from a surface. Sanitizers are responsible for the destruction of microorganisms on the said surface. It is crucial to start with a clean surface before applying a sanitizer because some sanitizers, like chlorine, can react with organic debris, which can render the sanitizer less effective. By cleaning the surface prior to disinfection, we are ensuring maximum contact between the sanitizer and the underlying surface. Understanding Sanitizer Effectiveness One of the key steps of guaranteeing the efficacy of your sanitation plan is choosing the correct type of sanitizer to control for the pathogens of interest-based on risk-assessment—more on that later. There are three additional factors in determining the effectiveness of a sanitizer for a specific application including the concentration of a sanitizer, temperature, and contact time. Concentration of Sanitizer Often times, sanitizers are sold as concentrates, and thus must be diluted to a target concentration before use. Industry guidelines, federal regulations, and manufacturer’s instructions are fantastic resources for determining the target concentrations for maximum effectiveness. Temperature Temperatures that are too high or too low can inhibit disinfection efficacy. It is important to consider the temperature of the environment in which the sanitizer will be applied. Most sanitizers work between the ranges of 55-120°F. Contact Time Most sanitizers do not kill microorganisms instantly. They require a minimum amount of time where they need to be in contact with the surface. There are general guidelines for contact time based on sanitizer class. Why is Concentration Measured? Sanitizers that are improperly mixed will have limited effectiveness, whereas sanitizers that are too strong can be toxic and leave unpleasant residuals in products. It is therefore critical to monitor the concentration of your sanitizers to ensure that they will achieve the intended disinfection in a safe manner. A lot of the focus of this presentation will be to look at the different testing methods for monitoring the concentration of these various sanitizers. How are Sanitizers Measured? Measurement techniques depend on the active ingredients of the chemical. However, there are several general technologies used to monitor concentration. Test Strips Pros: Inexpensive. Easy to use.Cons: Not very accurate. Very low resolution. Test strips are strips of paper laced with chemicals that will react with a sanitizer to produce a colour change. The colour of the strip is then compared to a colour chart to determine the concentration. These strips are convenient, easy to use, and relatively inexpensive. The downsides to test strips are that they offer a limited resolution, they are subjective to the user, and they provide little in the way of record keeping. Chemical Test Kits Pros: Easy to use. Colour change. Cons: You have to dispose of chemicals. Low resolution. With some chemical test kits, a sample of a certain size is collected, then chemicals or reagents are added to that sample to form a colour change. Just like with test strips this colour change is then matched to a gradient chart to determine the concentration. Other test kits are small-scale titrations (refer to titration section) where drops of a chemical are added to the sample until a colour change is observed. The number of drops used to produce that colour is then used in a calculation to determine the calculation. Similar to test strips, these methods of analysis are easy-to-use and relatively inexpensive, but again provide limited resolution and are subjective. Waste disposal of any hazardous chemicals may also apply. Photometry (and Spectrophotometry) Pros: Sometimes portable. More accurate. Sometimes customizable. Cons: More expensive. Requires more technical know-how. This technology operates under a similar principle to the chemical test kits. A sample is collected, reagents are added, and a colour change is produced. However, instead of manually assessing the colour based on a chart, an instrument with a photodetector interprets the results and provides a digital readout of concentration. This eliminates the subjectivity and provides more consistent results among operators. These tests can be subject to interferences from coloured or turbid samples as well as competing ions that may be present in the sample. Additional considerations for waste disposal may be necessary depending on the reagents. These instruments can vary in price, depending on the optical sophistication, range of wavelengths, and additional features like logging, which can assist with record keeping. Titration (Automatic Titration) Pros: Very accurate. Able to run multiple tests. Cons: Can be expensive. Requires training. Titration is a technique in which a chemical of a known concentration, “titrant” is added to a sample an analyte of unknown concentration until a colour change or other potentiometric signal occurs. The volume of titrant added is then used in a calculation to determine the concentration of the in order for this to work, the titrant and the analyte must have a known, predictable reaction. Titrations can be performed with droppers (chemical test kits), a manual burette with a stopcock, or via an automatic titration
The Importance of Measuring Turbidity in Water Turbidity of water is an optical property that causes light to be scattered and absorbed, rather than transmitted. The scattering of light that passes through a liquid is primarily caused by suspended solids. The higher the turbidity, the greater the amount of scattered light. Even a very pure fluid will scatter light to a certain degree; no solution will have zero turbidity. There are different measurement standards used based on applications, and with these standards are applied units. The ISO standard adopted the FNU (Formazin Nephelometric Unit) while the EPA uses the NTU (Nephelometric Turbidity Unit). Other units include the JTU (Jackson Turbidity Unit), FTU (Formazin Turbidity Unit), EBC (European Brewery Convention Turbidity Unit) and diatomaceous earth (mg/L SiO₂). There is a number of application areas where turbidity is a required parameter to measure. Monitoring for Natural Water Supplies In natural water, turbidity measurements are taken to gauge general water quality and its compatibility in applications where there are aquatic organisms. It has been found that there is a strong correlation between turbidity and BOD (Biochemical Oxygen Demand) value. Moreover, by definition, turbidity obstructs light, thus reducing the growth of marine plants, eggs and larvae, which are usually found in the lower levels of an aquatic ecosystem. Wastewater Treatment and Turbidity Historically, turbidity is one of the main parameters monitored in wastewater. In fact, the monitoring and treatment process was once solely based on the control of turbidity. Currently, the measurement of turbidity at the end of the wastewater treatment process is necessary to verify that the values are within regulatory standards. Generally speaking, the turbidity value has to be between 0 and 50 FTU, with an accuracy of ±3 FTU depending on the phase of the wastewater treatment process. By monitoring the turbidity level, it can be determined if the different stages of the process, particularly in the filtration and purification stages, have been completed correctly. Purification of Drinking Water Turbidity is one of the most important parameters used to determine the quality of drinking water. Public water suppliers are required to treat their water to remove turbidity. Bestpractice operation of a conventional water treatment plant should be able to produce treated water with aturbidity of less than 0.1 nephelometric turbidity units (NTU). According to Australian Drinking Water Guidelines, turbidity cannot be higher than 1.0 nephelometric turbidity units (NTU) at the plant outlet. Adequately treated surface water does not usually present a turbidity problem. The World Health Organization indicates 5 NTU as the reference turbidity value of water for trade. This value has been established based on the aesthetic characteristics of water. From a hygienic point of view, 1 NTU is the recommended value. Many drinking water utilities strive to achieve levels as low as 0.1 NTU. Turbidity is an indicator and will not give results for a specific pollutant. It will, however, provide information on the degree of overall contamination. The flow chart for the water treatment process of drinking water shows the turbidity reference values for each phase. Typical sources of turbidity in drinking water include the following: • Waste discharge • Run-off from watersheds, especially those that are disturbed or eroding • Algae or aquatic weeds and products of their breakdown in water reservoirs, rivers, or lakes • Humic acids and other organic compounds resulting from decay of plants, leaves, etc. in water sources • High iron concentrations which give water a rust-red coloration (mainly in ground water and ground water under the direct influence of surface water) • Air bubbles and particles from the treatment process Related posts Turbidity Meter Calibration: A Step-by-Step Guide Turbidity Meter Calibration: A Step-by-Step Guide Turbidity meters are essential tools for monitoring water quality in various industries, including environmental… Read more Measuring Chlorine & Turbidity in Reticulation Systems or for Mains Breaks Measuring Chlorine & Turbidity in Reticulation Systems or for Mains Breaks Twenty years ago in July-September 1998, Sydney experienced a… Read more The Complete Guide to Measuring Turbidity in Water The Complete Guide to Measuring Turbidity in Water Turbidity is one of the most common and intuitive qualities of water.… Read more Subscribe to our newsletter
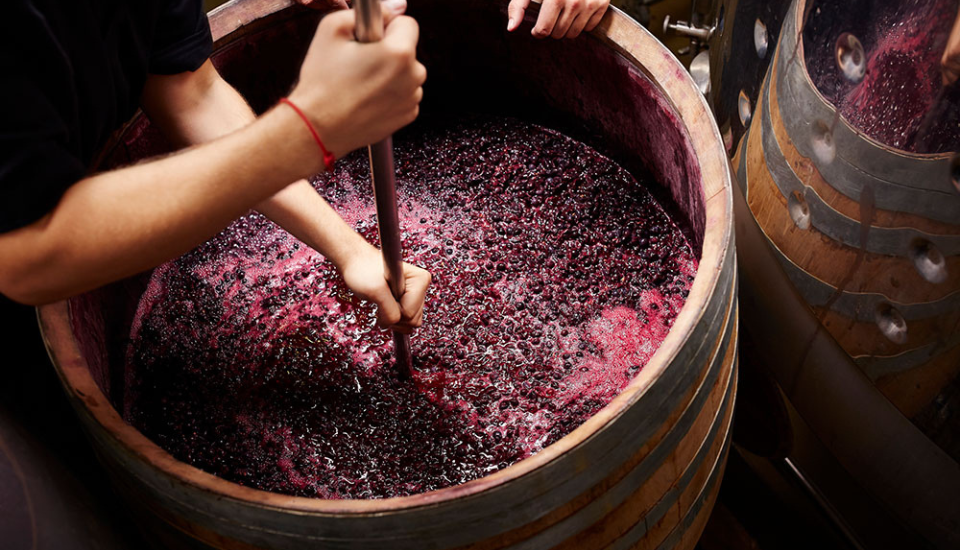
Quality Control of Malic Acid in the Winery The process of fermentation was a mystery for the bulk of recorded human history. Microscopy and modern-day research have given us a solid understanding of the microbial processes that occur during winemaking, but even with those understandings and advances, the fermentation process can be a bit challenging for some to grasp. This is especially true when it comes to that other fermentation – the malolactic conversion. Whereas the primary alcoholic fermentation is clear with its rigorous bubbling of CO2 and obvious sensory changes of diminishing sugar sweetness and increasing post-fermentation bouquet, the malolactic fermentation is very subtle. At most you may hear the slight crackle of gas bubbles evolving from solution, or note mild decreases in acidity with rounder, richer mouthfeel from the wines. Unlike the alcoholic fermentation though, there are really no clear signals as to when the fermentation commences and when it finishes beyond perhaps a few bungs popping out of barrels. A basic understanding of the malolactic fermentation and how to manage wines with malic acid present is key for winemakers though, as improper handling in the cellar and at bottling can lead to spoilage or an ML fermentation occurring in bottle, ruining an entire product run. The Need for Malolactic Management in Winemaking The presence of appreciable amounts of malic acid essentially renders a wine microbially unstable. There are a number of common microbes involved in the winemaking process capable of utilizing malic acid as an energy source, and they will actively ferment the malic acid to a series of different end products, some of which are desirable, but many of which can be unpleasant from a sensory standpoint. The largest issue by far in management of the ML process is that some microbes will convert malic acid to acetic acid in the fermentative process, often producing acetic acid concentrations that exceed threshold, and at times legal limit levels in wine. This is a clear spoilage and requires specialized filtration processes to remove the acetic acid, or the product is simply unsellable as a finished wine. Even the desired ML fermentation from oenococcus bacteria will produce moderate increases in acetic acid concentrations, so careful tracking of a healthy ML becomes critical in preventing vinegar spoilage in winemaking. Beyond acetic acid spoilage, wines with malic acid present become opportunistic media for other spoilage issues. Any wine microbe with metabolic pathways for converting malic acid are capable of utilizing it as an energy substrate for growth. Some of the more exotic spoilages, such as ropiness from lactic acid bacteria, can often be the result of poor malic acid management practices in the cellar allowing microbial blooms to occur. As with the alcoholic fermentation, inoculation with desired microbes and the tracking of the fermentation process to completion are recommended, followed by a continued protocol of SO2 management once the ML fermentation is complete; or a well-managed SO2 and isolation protocol for wines where no ML fermentation is desired, such as a crisp Sauvignon Blanc. Any wine with what is considered an incomplete ML fermentation (anything above 50 mg/L) should also receive sterile filtration protocols at bottling to avoid any malolactic activity occurring after final packaging. Paper Chromatography for Malic Acid Testing in Wine The easiest way to monitor your ML fermentation is to send wine samples to an outside third-party lab service that can run the testing for you. At some point though, this becomes cost prohibitive for many wineries and they seek to move ML monitoring in-house. The poor man’s ML test is to use paper chromatography. Chromatography paper is marked along the bottom with small samples of wine, as well as standards for malic acid and lactic acid. The paper is then placed into a jar with a small amount of an organic solvent usually made up of formic acid, butanol, water, and a bromocresol green indicator dye. The solvent will travel up the paper by capillary action over a period of several hours and the main acids of tartaric, malic, and lactic will separate by mass, reaching different points on the paper. Once finished the paper is removed and allowed to dry. The dye indicator will turn the paper greenish in color, however, the points of acid will turn yellow. As the malic acid is converted to lactic acid, the points for malic acid will slowly fade away and disappear altogether over subsequent tests. The main benefit of paper chromatography is that tests are fairly easy to run and generally inexpensive. Its drawbacks though are in handling the organic solvent chemicals, and the fact that the test is largely qualitative in nature. It’s not able to tell you the concentration of malic acid in your wine, just whether any shows by chromatography separation. The limits of paper testing generally tend to be in the high range of what is considered complete ML fermentations, so some winemakers may call an ML complete by paper test when in fact the process is still ongoing. The Quantitative Advance to Spectrophotometry in Testing for Malic Acid in Wine As advancing needs for quality control, sample throughput, and accuracy become key for winemakers, most wineries will eventually jump to the quantitative means of measuring malic acid in wine – enzymatic testing by spectrophotometer. Enzyme kits in wine analysis commonly run at 340 nm in wavelength with 10 mm square cuvettes. In the case of malic acid analysis, the underlying reaction is a conversion of L-malic acid to oxaloacetate by the L-malate dehydrogenase enzyme. During the reaction, NAD+ is converted to NADH in a 1-to-1 direct stoichiometric ratio to lactic acid, and it’s actually the NAD+/NADH conversion detected by the spec in measurement. A second reaction also occurs taking the oxaloacetate and L-glutamate to L-aspartate and alpha-ketoglutarate. The purpose of the second reaction is to drive the equilibrium of the malic acid conversion from the first reaction to completion. The drawbacks to enzymatic testing are the initial up-front costs associated with purchasing a spectrophotometer, as well as the
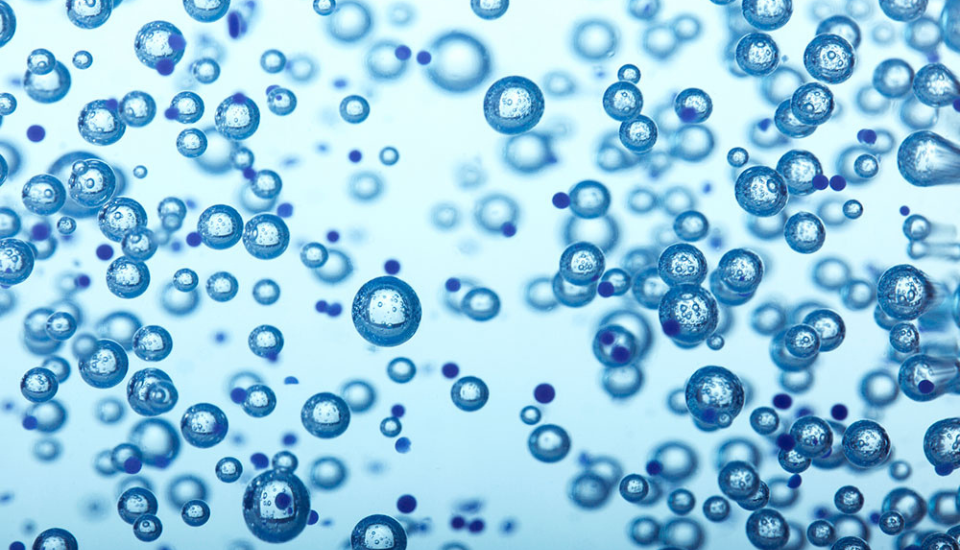
Measuring Dissolved Oxygen in Nanobubbles Microbubble or nanobubble technology has attracted attention of scientists in recent years. It is an important technology in the agriculture, hydroponic, and aquaculture industries. Some of the applications of nanobubbles which have been explored around the globe are: Acceleration of metabolism in vegetables and shellfishes Improved shelf stability of products with bubbles (foam products) Nutritional supplement carrier in the food industry Improved delivery of chemotherapy drugs in cancer patients Sterilisation using ozone gas Water treatment by flotation Recently, a hydroponic customer approached Hanna Instruments to provide a solution for testing Dissolved Oxygen in nanobubbles. Hydroponic growers are using microbubbles to increase the nutrient absorption of crops and to increase the growth of plants. By adding microbubbles, the roots spread and crops grow 1.5 times faster. The leaves on the crop are greener and the structure of the stems are largely different. The size of these bubbles are 100 nm (0.0001 mm) and therefore, it could not be effectively measured with the galvanic or polarographic dissolved oxygen probes. The Hanna HI 98198 OPDO was the right fit for the application because it does not require the flow the polarographic or galvanic sensors require. The dissolved oxygen in the nutrient solution needs to be within a range of 20 ppm to 25 ppm to maximise the effectiveness of the nanobubbles on the crops. The Optical Dissolved Oxygen Meter’s measurement range is 0.00-50 ppm so it covered the range, and the accuracy of the reading within this range is +/- 1.5% of the reading which was acceptable to the customer. Applications for microbubbles and nanobubbles will continue to be developed in the future. In the aquaculture industry, it is used to increase crop yield by using water-containing nanobubbles without changing the size of the water tank. Farmers are feeding high-oxygen concentrated water to pigs and cows which leads to lowered feed consumption of about half. Despite of feed quantity being cut by half, the body of the pigs is not thinned and the meat remains tender. Researchers from the University of Texas MD Anderson Cancer Center, Rice University and Baylor College of Medicine found that the delivery of chemotherapy drugs with nanobubbles is 30 times more effective at killing cancer cells, reducing the required dosage compared to conventional treatment. In the beauty and cosmetics industry, research on skin rejuvenation is being carried out by putting nanobubbles into the blood. These applications emphasize the growing significance and demand for nanobubbles across a wide variety of applications. Related posts Guide to Chemical Oxygen Demand (COD) Testing Guide to Chemical Oxygen Demand (COD) Testing Chemical oxygen demand (COD) is a critical waste treatment measurement in everything from municipal systems… Read more Measuring Dissolved Oxygen of Hydroponic Nutrient Solutions Measuring Dissolved Oxygen of Hydroponic Nutrient Solutions In hydroponic growing systems, plants are grown in a soilless environment and receive… Read more Environmental Monitoring of Nitrates and Other Water Quality Parameters: pH, Dissolved Oxygen (DO), Turbidity Environmental Monitoring of Nitrates and Other Water Quality Parameters: pH, Dissolved Oxygen (DO), Turbidity Nitrate is one of the most… Read more Subscribe to our newsletter